Improved forecasting of day-ahead prices: SpotEx15 new features
On 1 October 2025, Insight by Volue launched a new version of SpotEx, Volue’s in-house short-term forecast covering the next 90 days ahead.
Forfatter
Silvia Messa
Publisert
27. nov. 2025

The SpotEx model is a two-step algorithm composed of an effective merit order forecast and cross-border exchange forecast.
We use our high quality in-house fundamental forecasts (e.g. wind, SPV) alongside Urgent Market Messages (UMMs) data and thermal availability forecasts to estimate these curves. The price-volume curves are trained upon the arrival of new actual day-ahead prices to ensure that our price forecasts are both dynamic and always fully updated with the newest market information. The underlying models depend on the price area and are a collection of different machine learning models.
SpotEx aims to maximise the total welfare optimisation function for all European countries simultaneously. The welfare optimisation relates to the power production and consumption in the given countries, as well as cross-border flows. The algorithm calculates explicit, implicit, and flow-based allocations in one go. The SpotEx algorithm is a simplified version of Euphemia that we use to forecast all Continental Europe and the Nordics. Cross-border capacities forecasts are based on ATC exchange forecasts from TSOs, continuously updated UMMs data on specific borders, and PTDFs forecasts of the flow-based domains for CORE and the Nordics based on data from JAO.
Adapting SpotEx to the 15-minute SDAC structure
The new version of the model, SpotEx15, launched on 1 October, was designed to replicate the changes for the whole Single Day Ahead Coupling area (SDAC) in the spot exchange that shifted to 15-minute granularity.
Since the change in granularity, the prices out of the spot exchange have been characterised by a saw-tooth pattern with different magnitudes depending on the market and the fundamentals. This zig-zag pattern has been observed in the Intraday Auctions (IDAs) since their introduction and reflects the different weights of the four 15-minute slots in one hour, due mainly to the ramps.
On 11 November, our team of developers, who constantly works on the performance of the model, released an updated version of the algorithm which led to major improvements.
Performance improvements after the November release
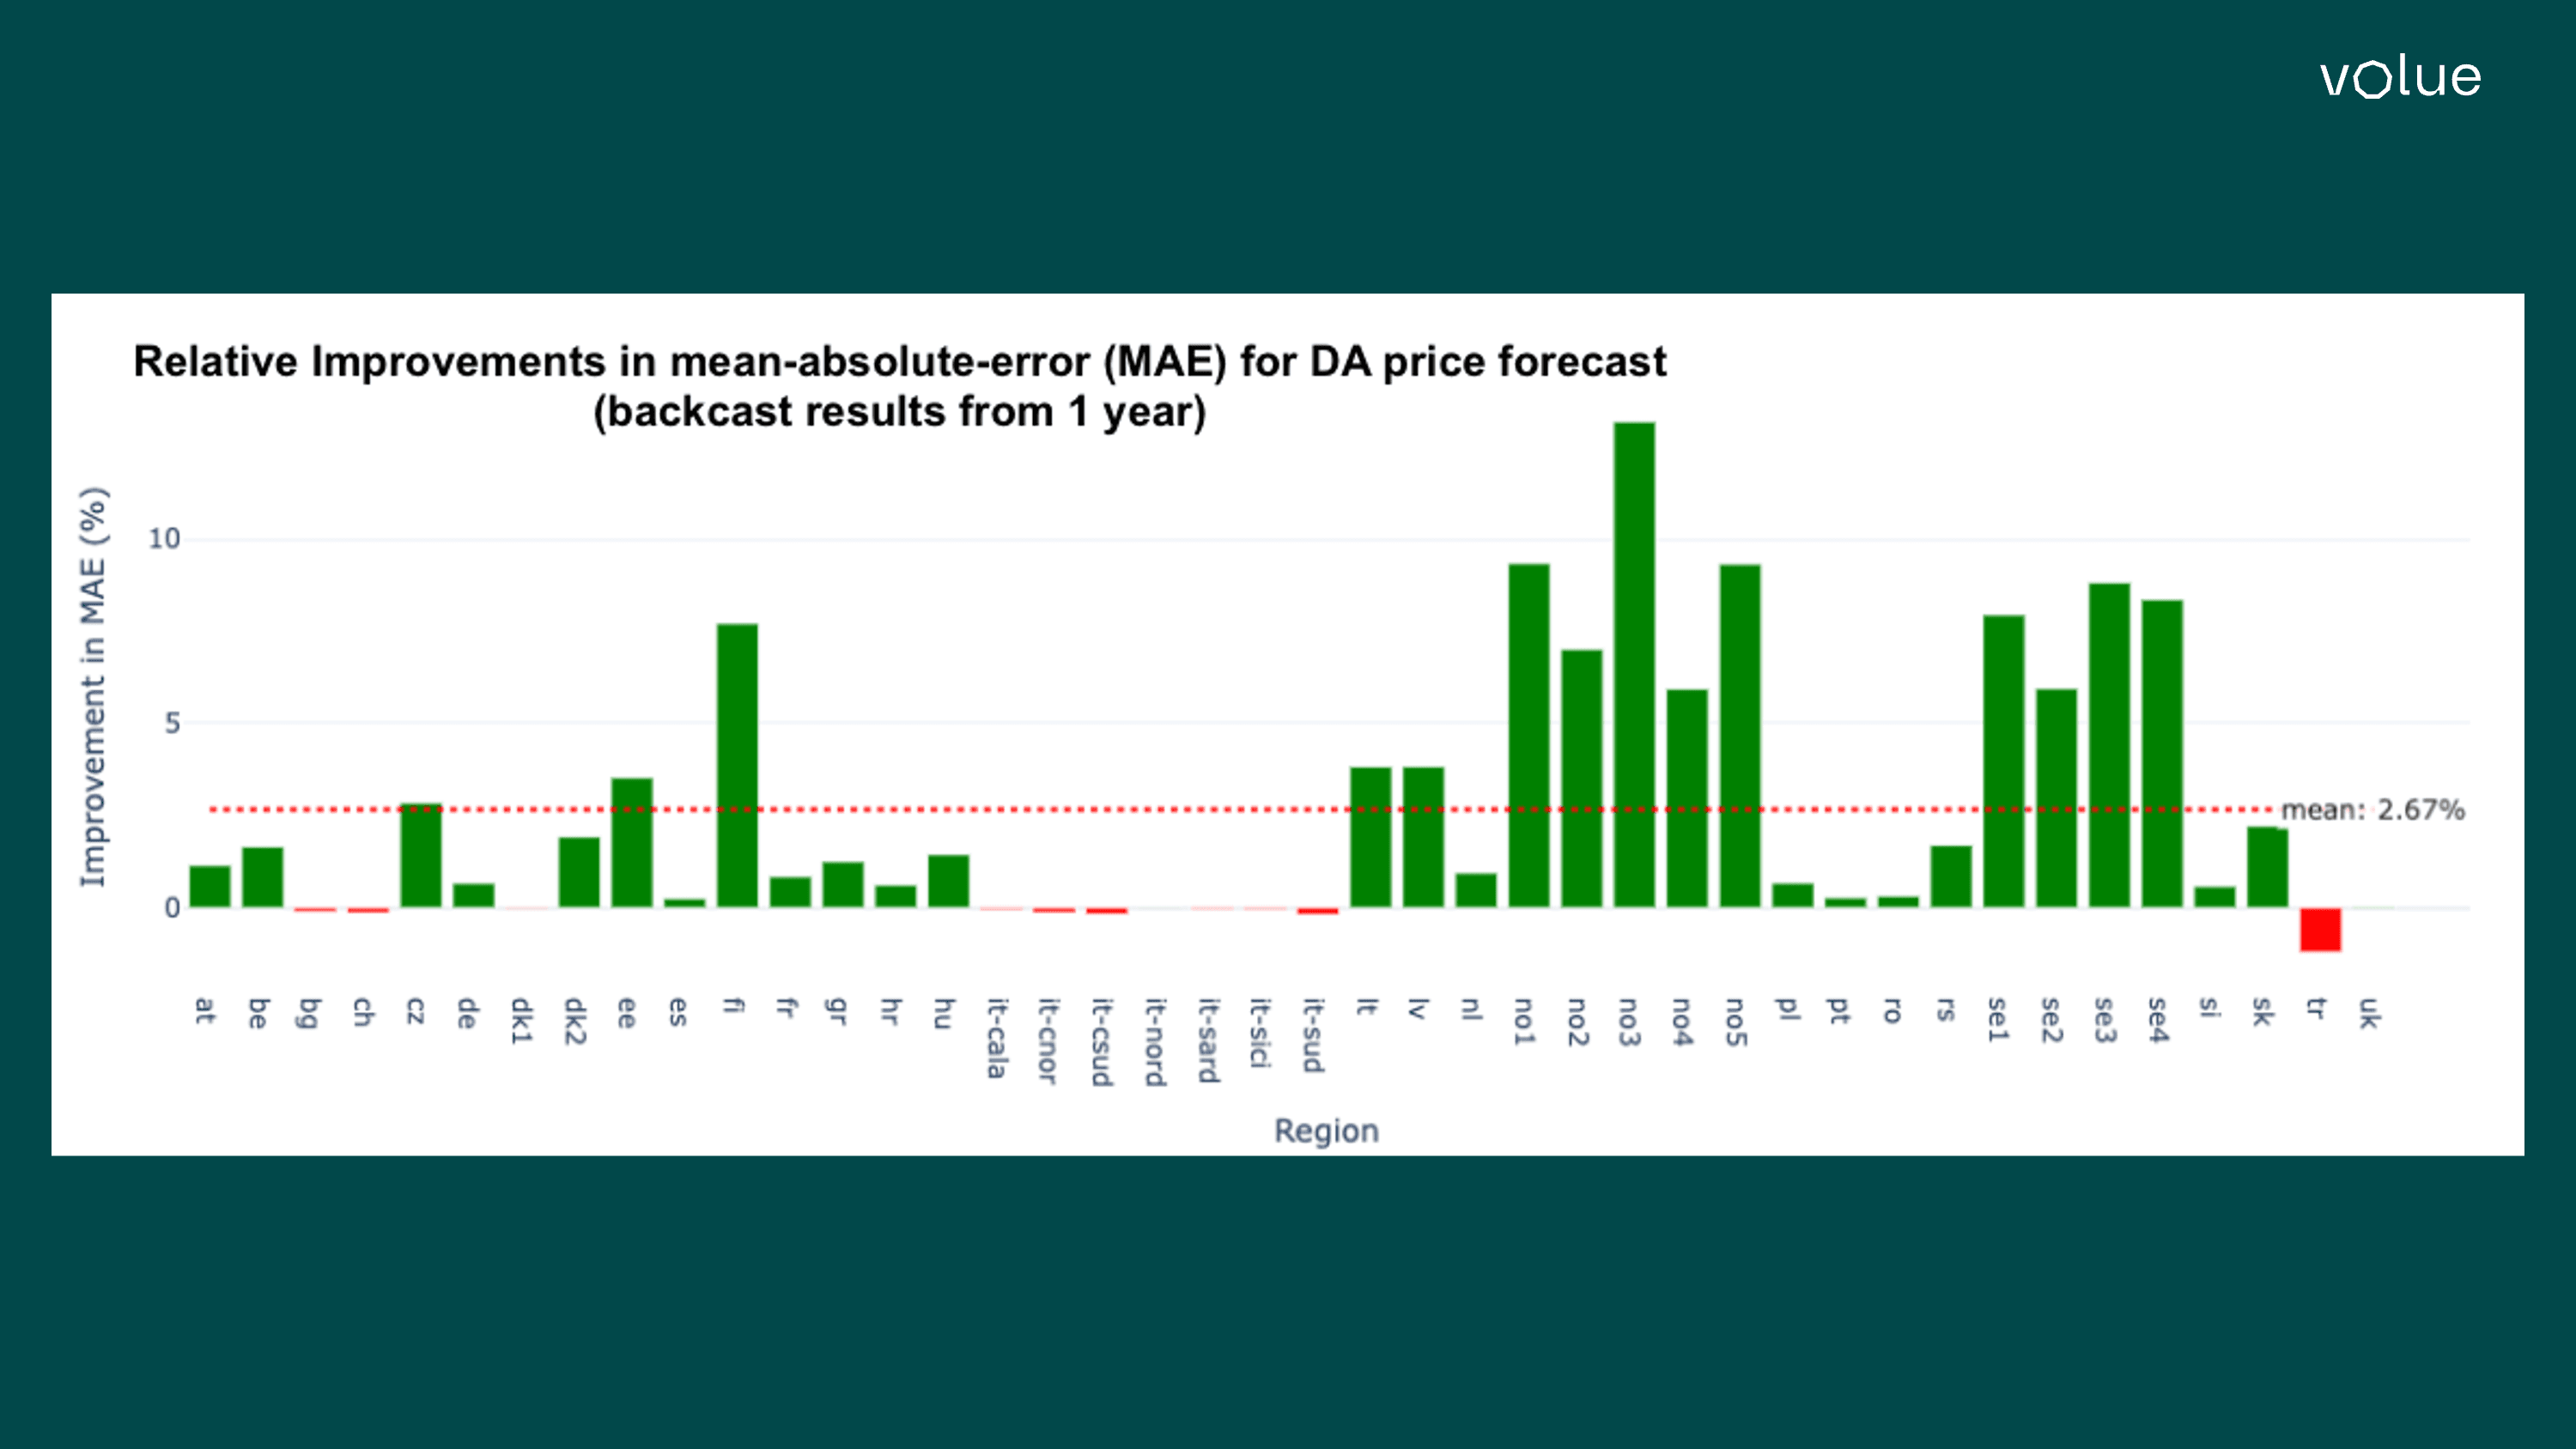
The first change is about the flow-based domain forecast for day+1 and day+2.
We back-casted one year of history, comparing the current version of the PTDF forecast for day+1 prior to the publication of the official JAO preliminary PTDF with the one used in the previous model release. We observe overall improvements in Mean Absolute Error (MAE), affecting mainly the Nordics: Finland, Norway, and Sweden improved by 5-10%. For continental Europe, the changes have impacted the forecast within the so-called CORE area by 3-5%.
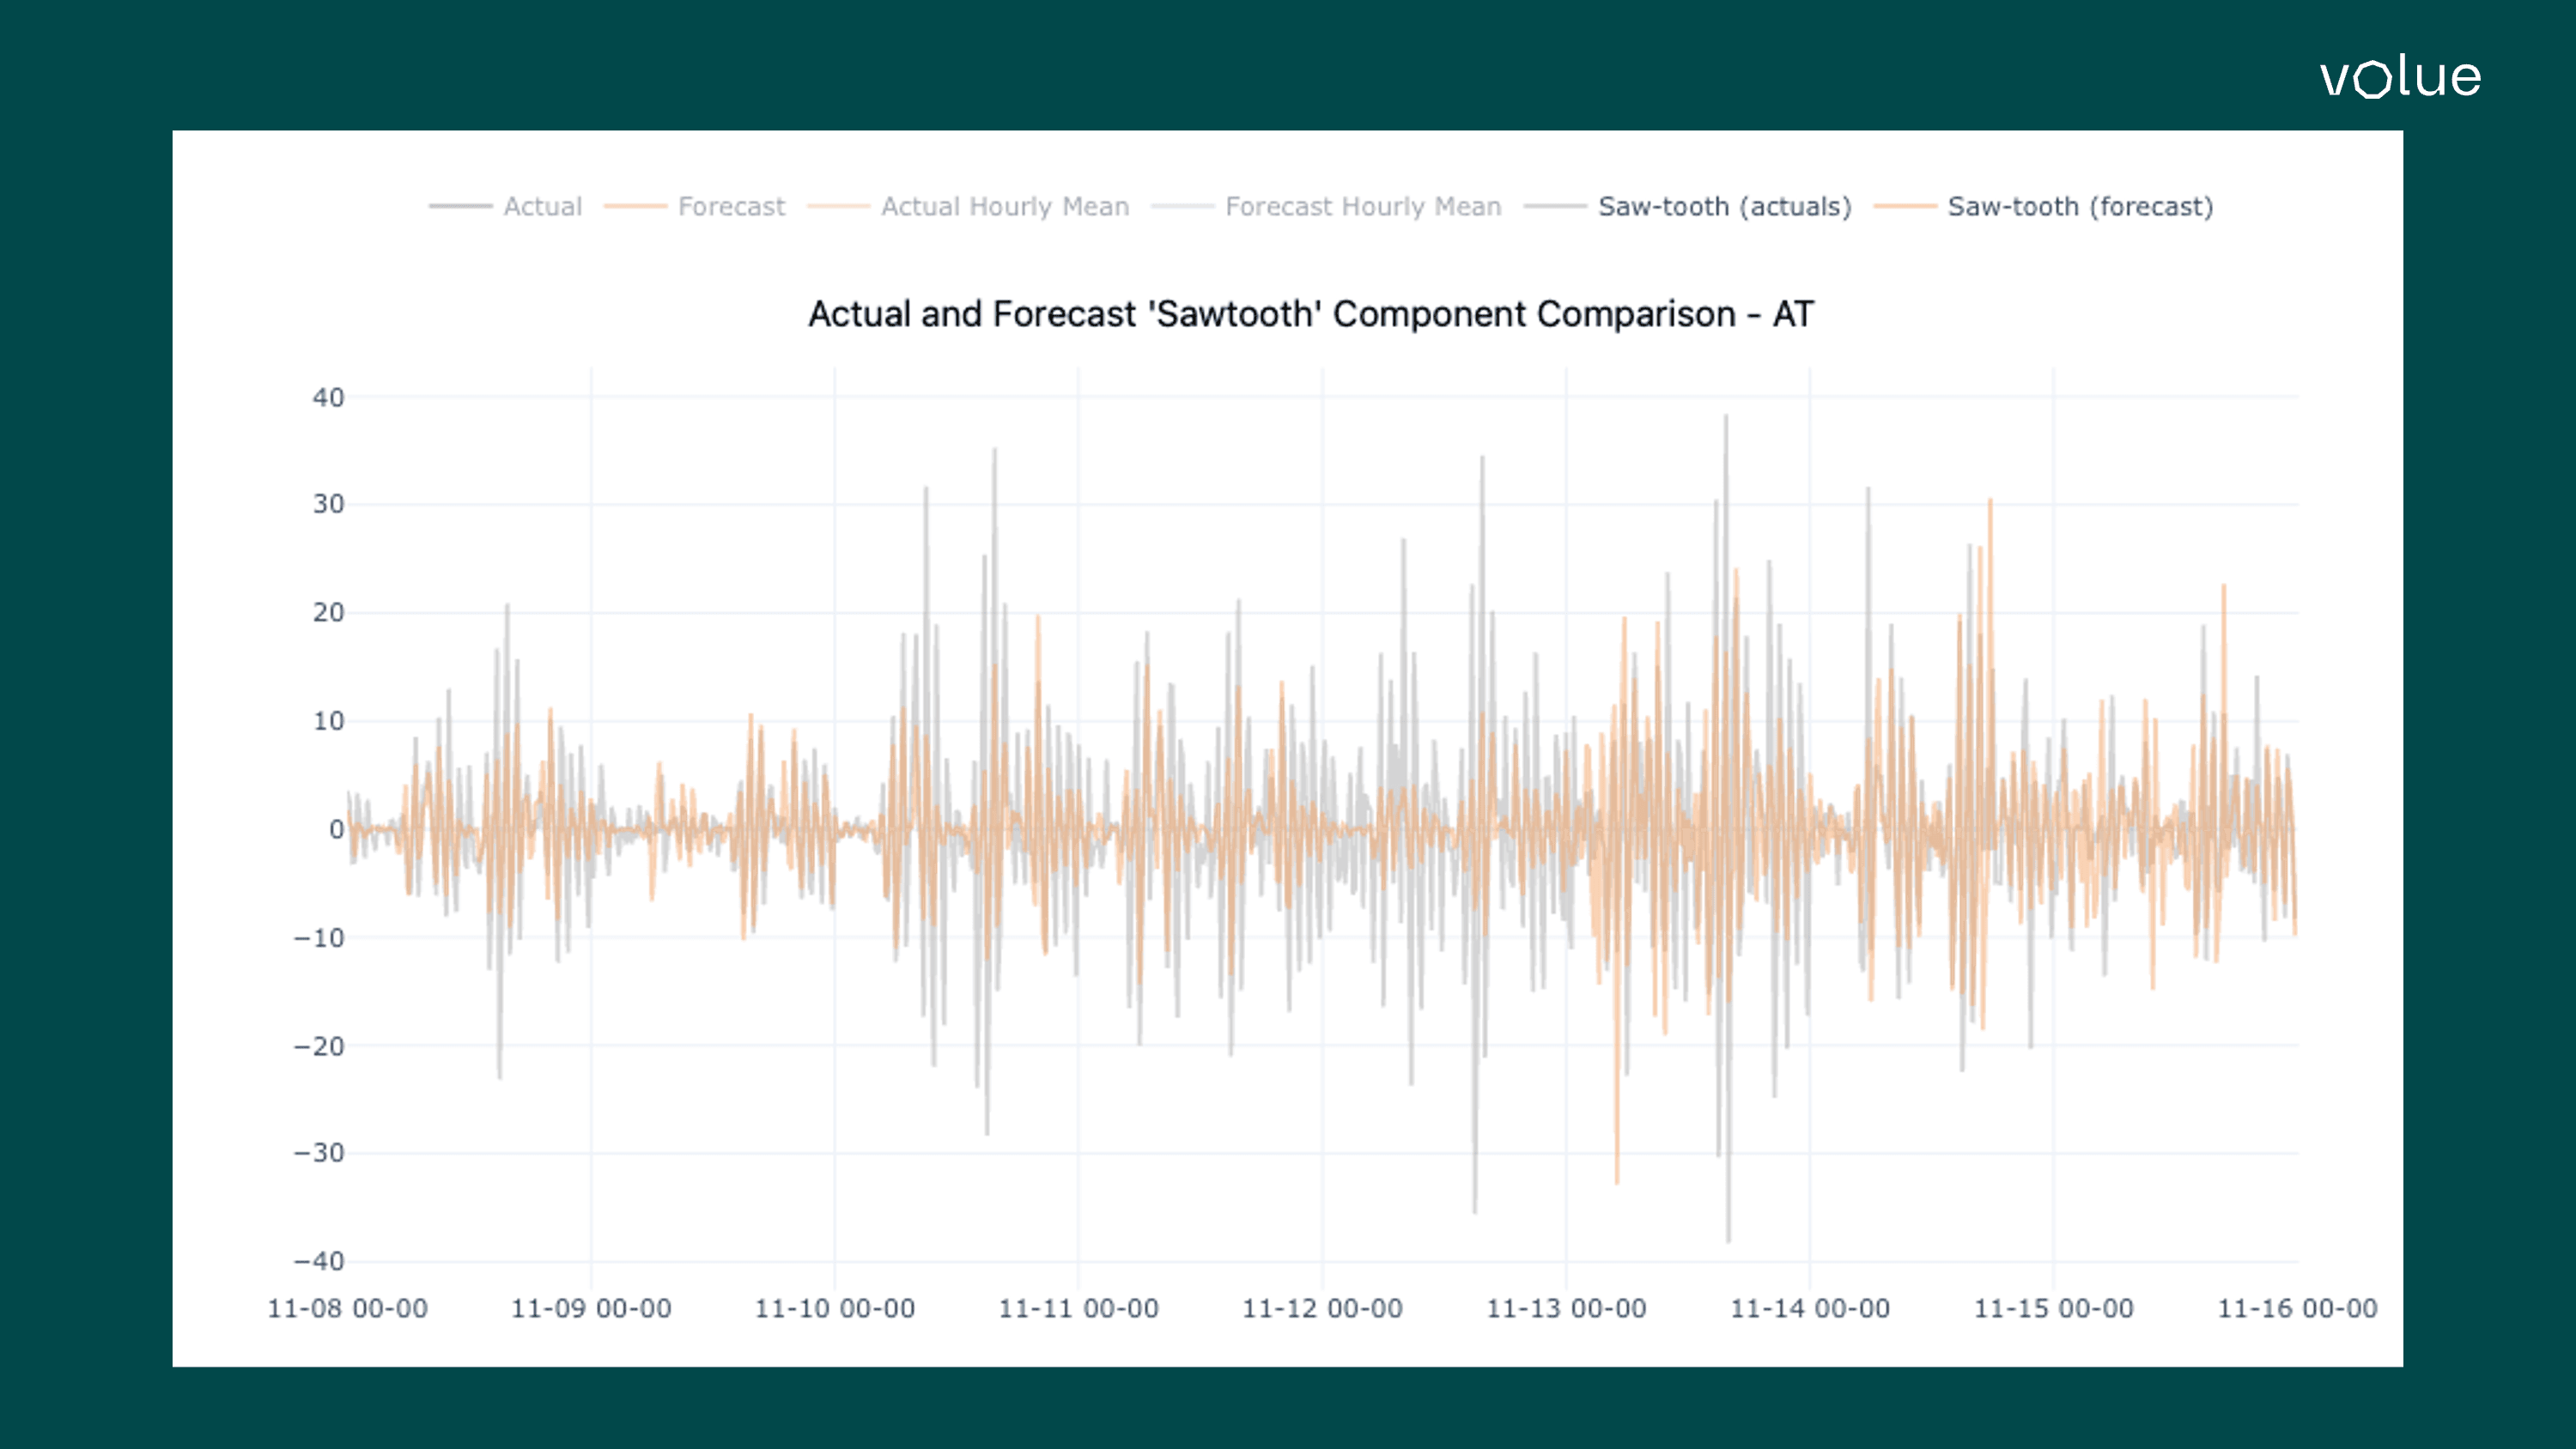
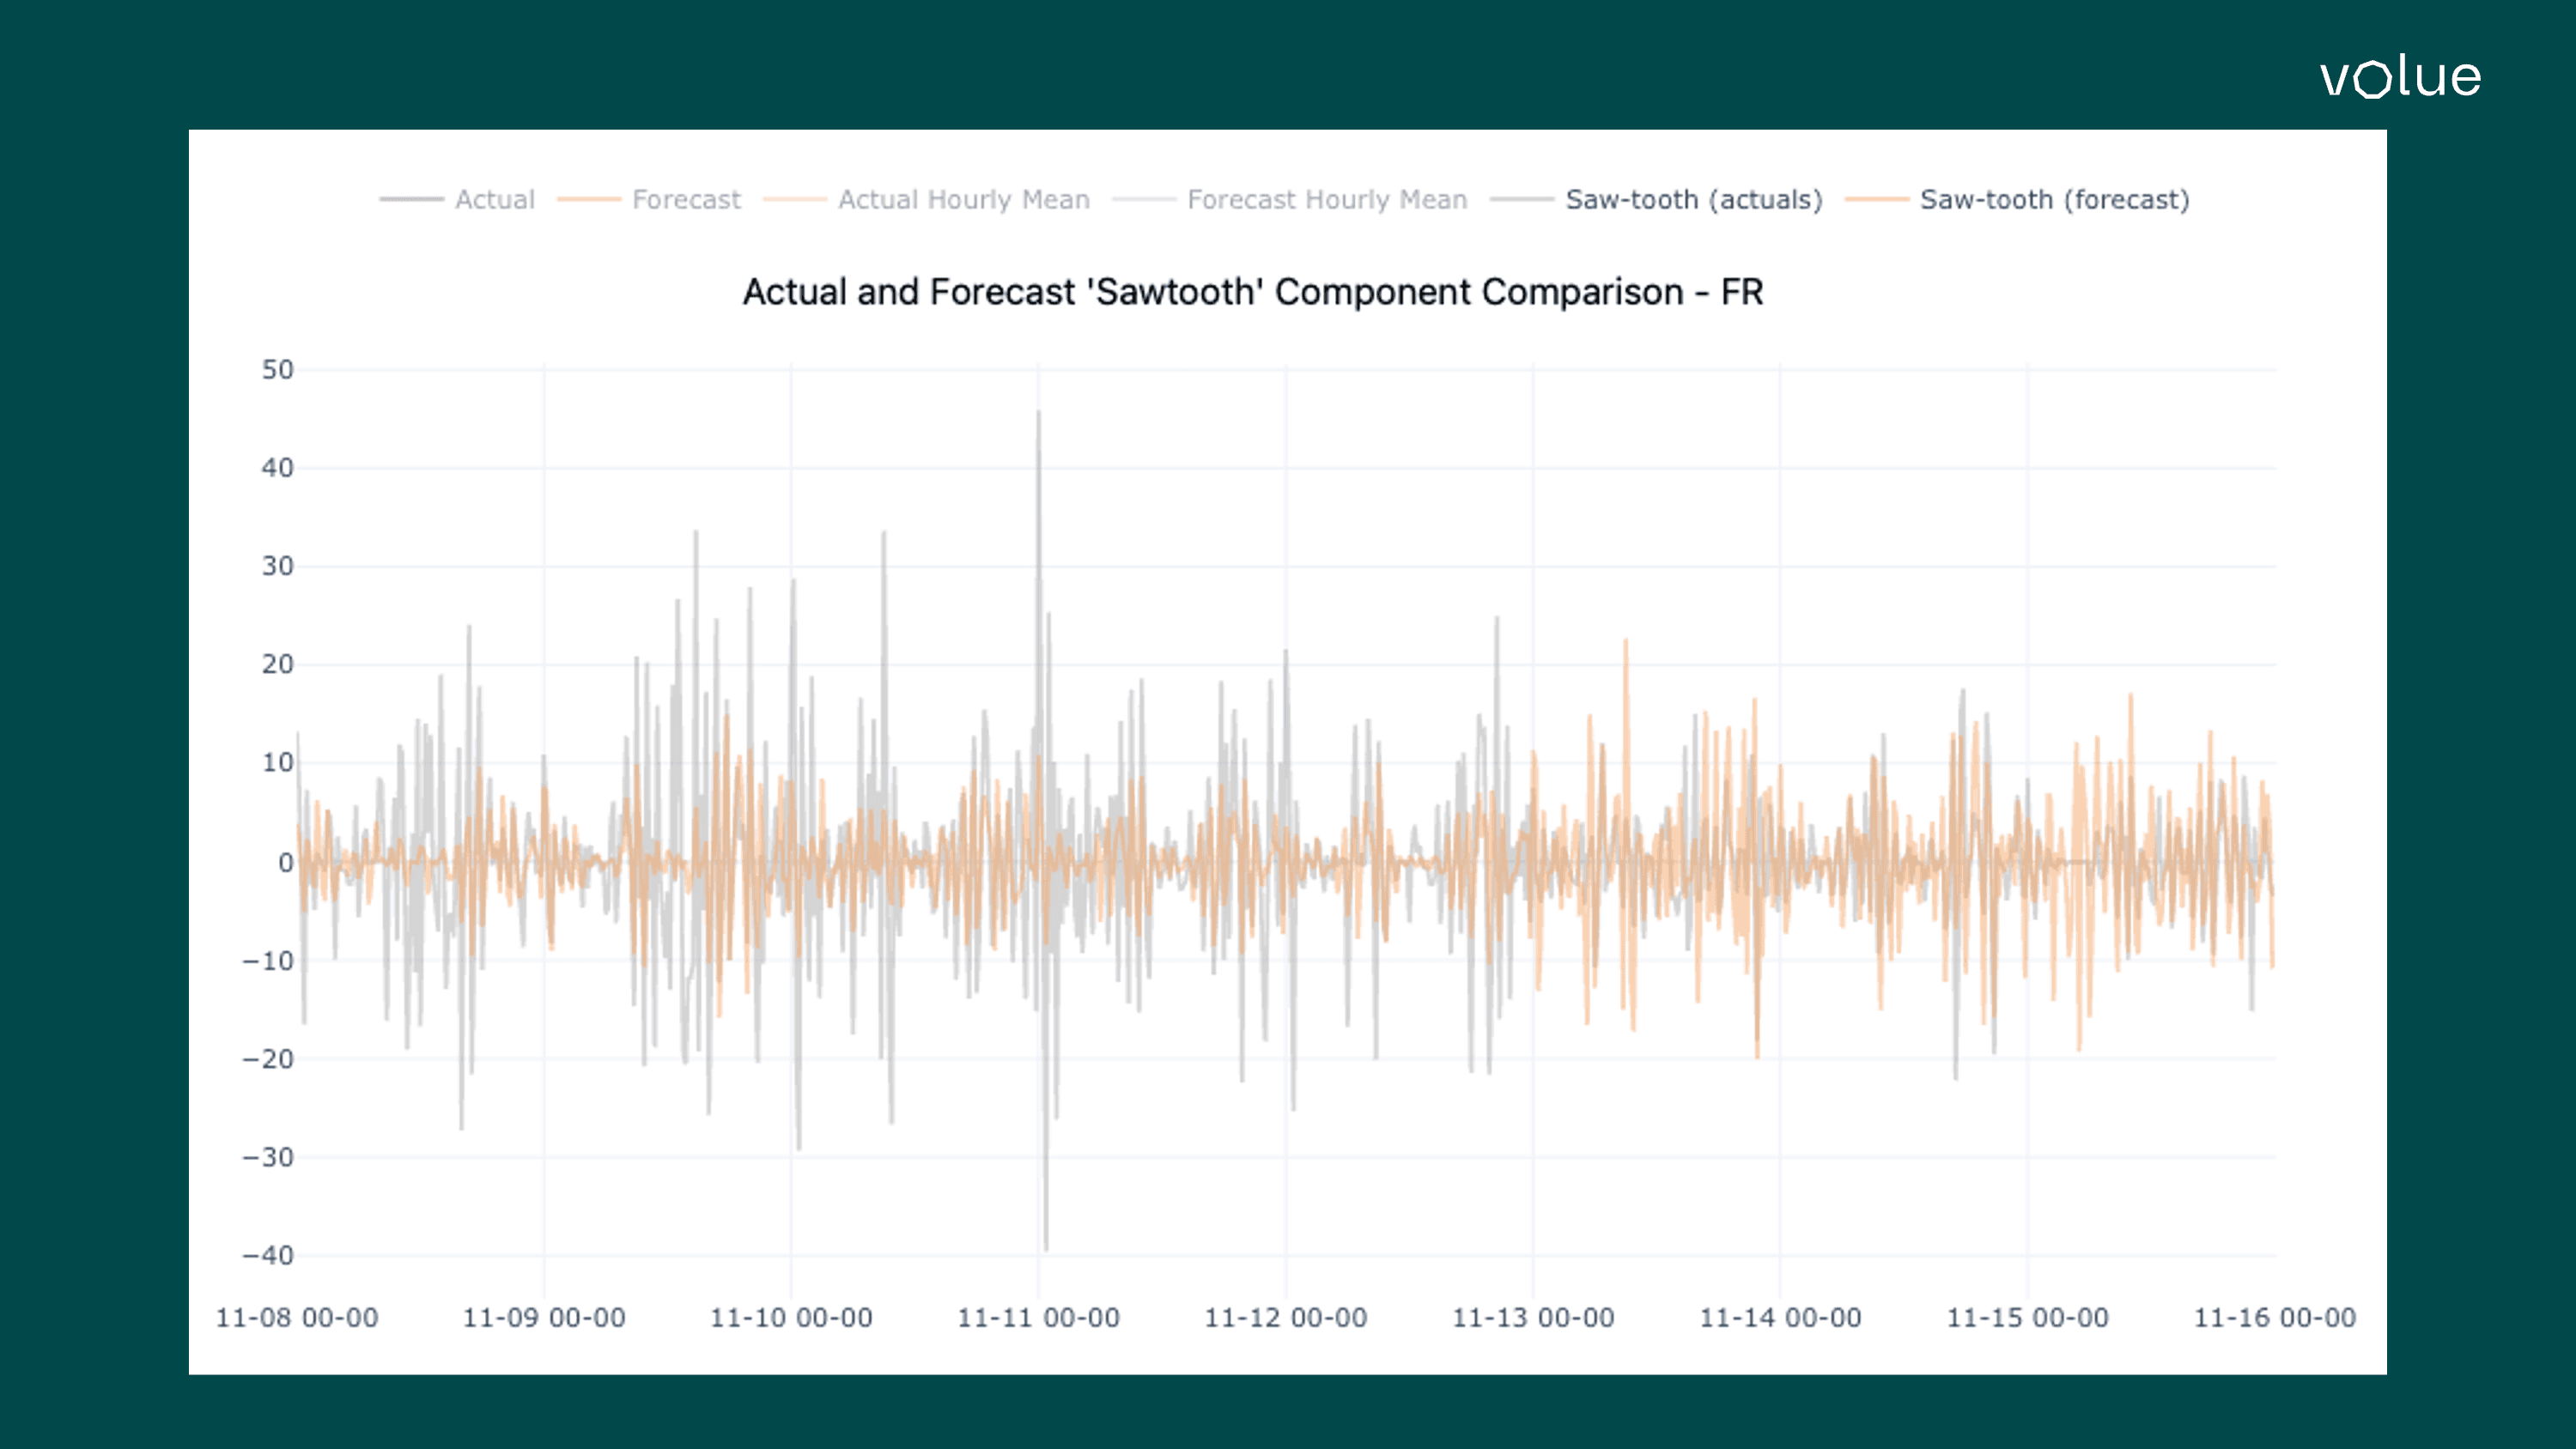
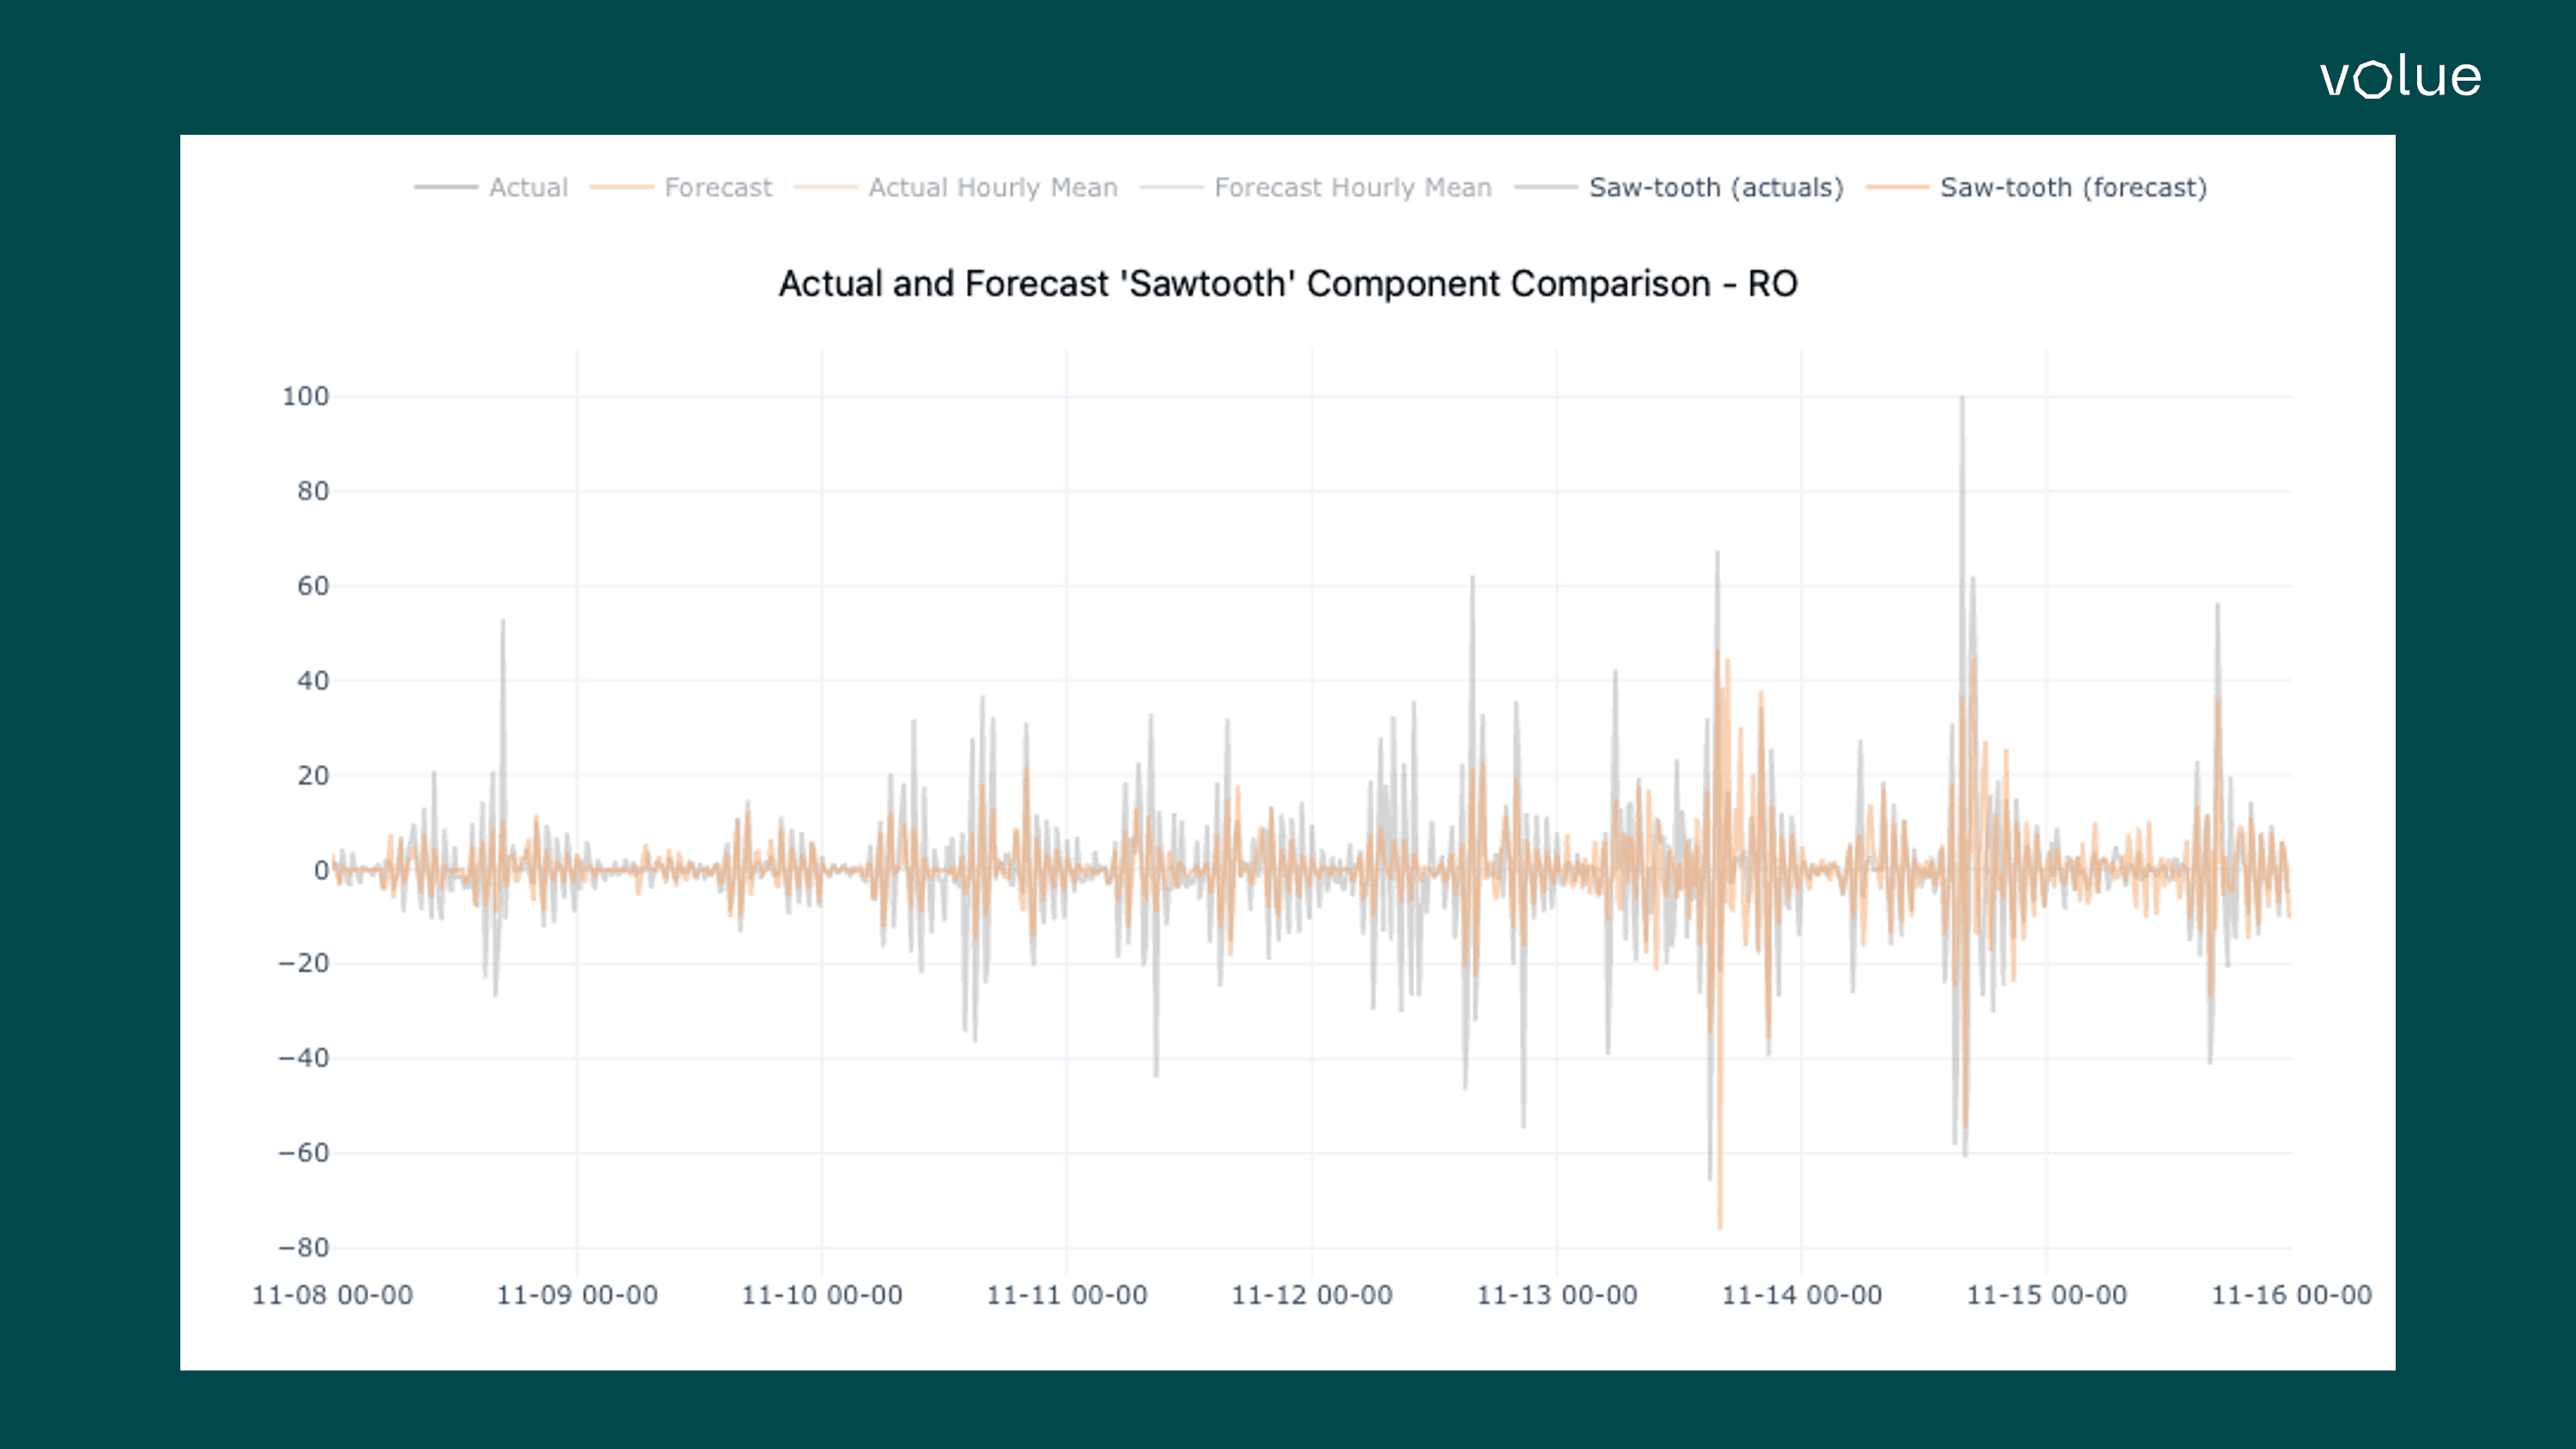
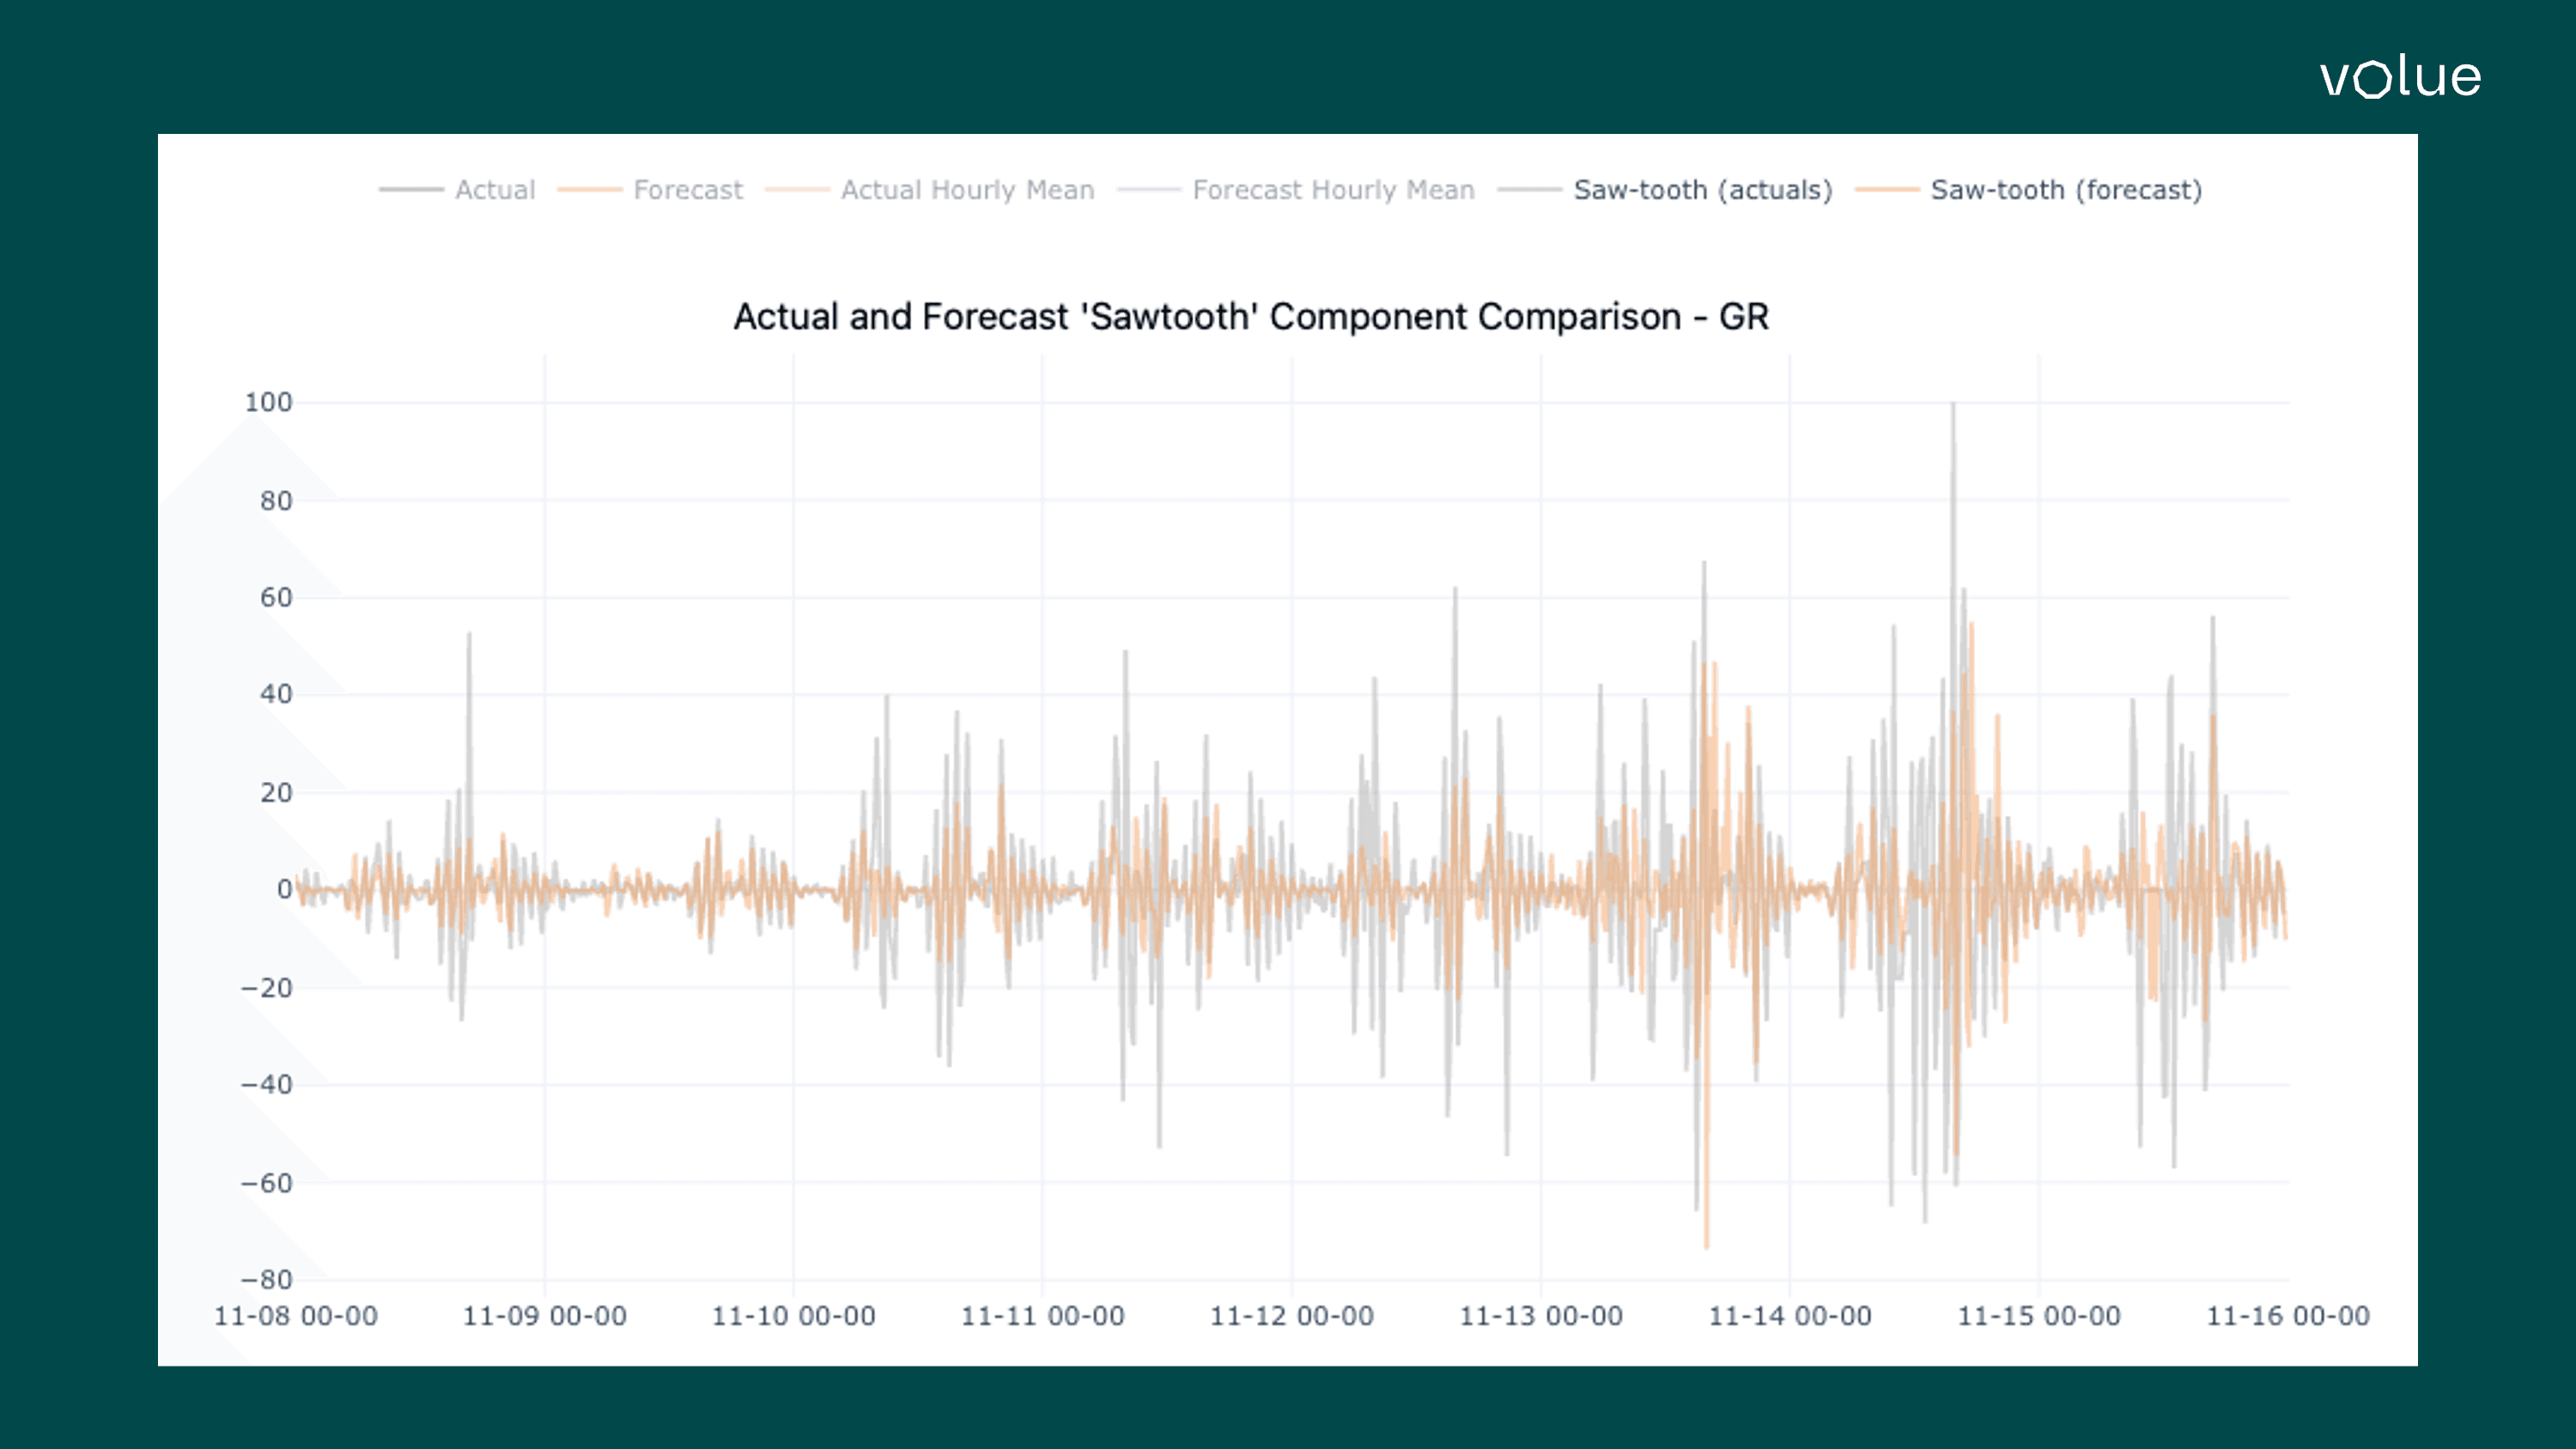
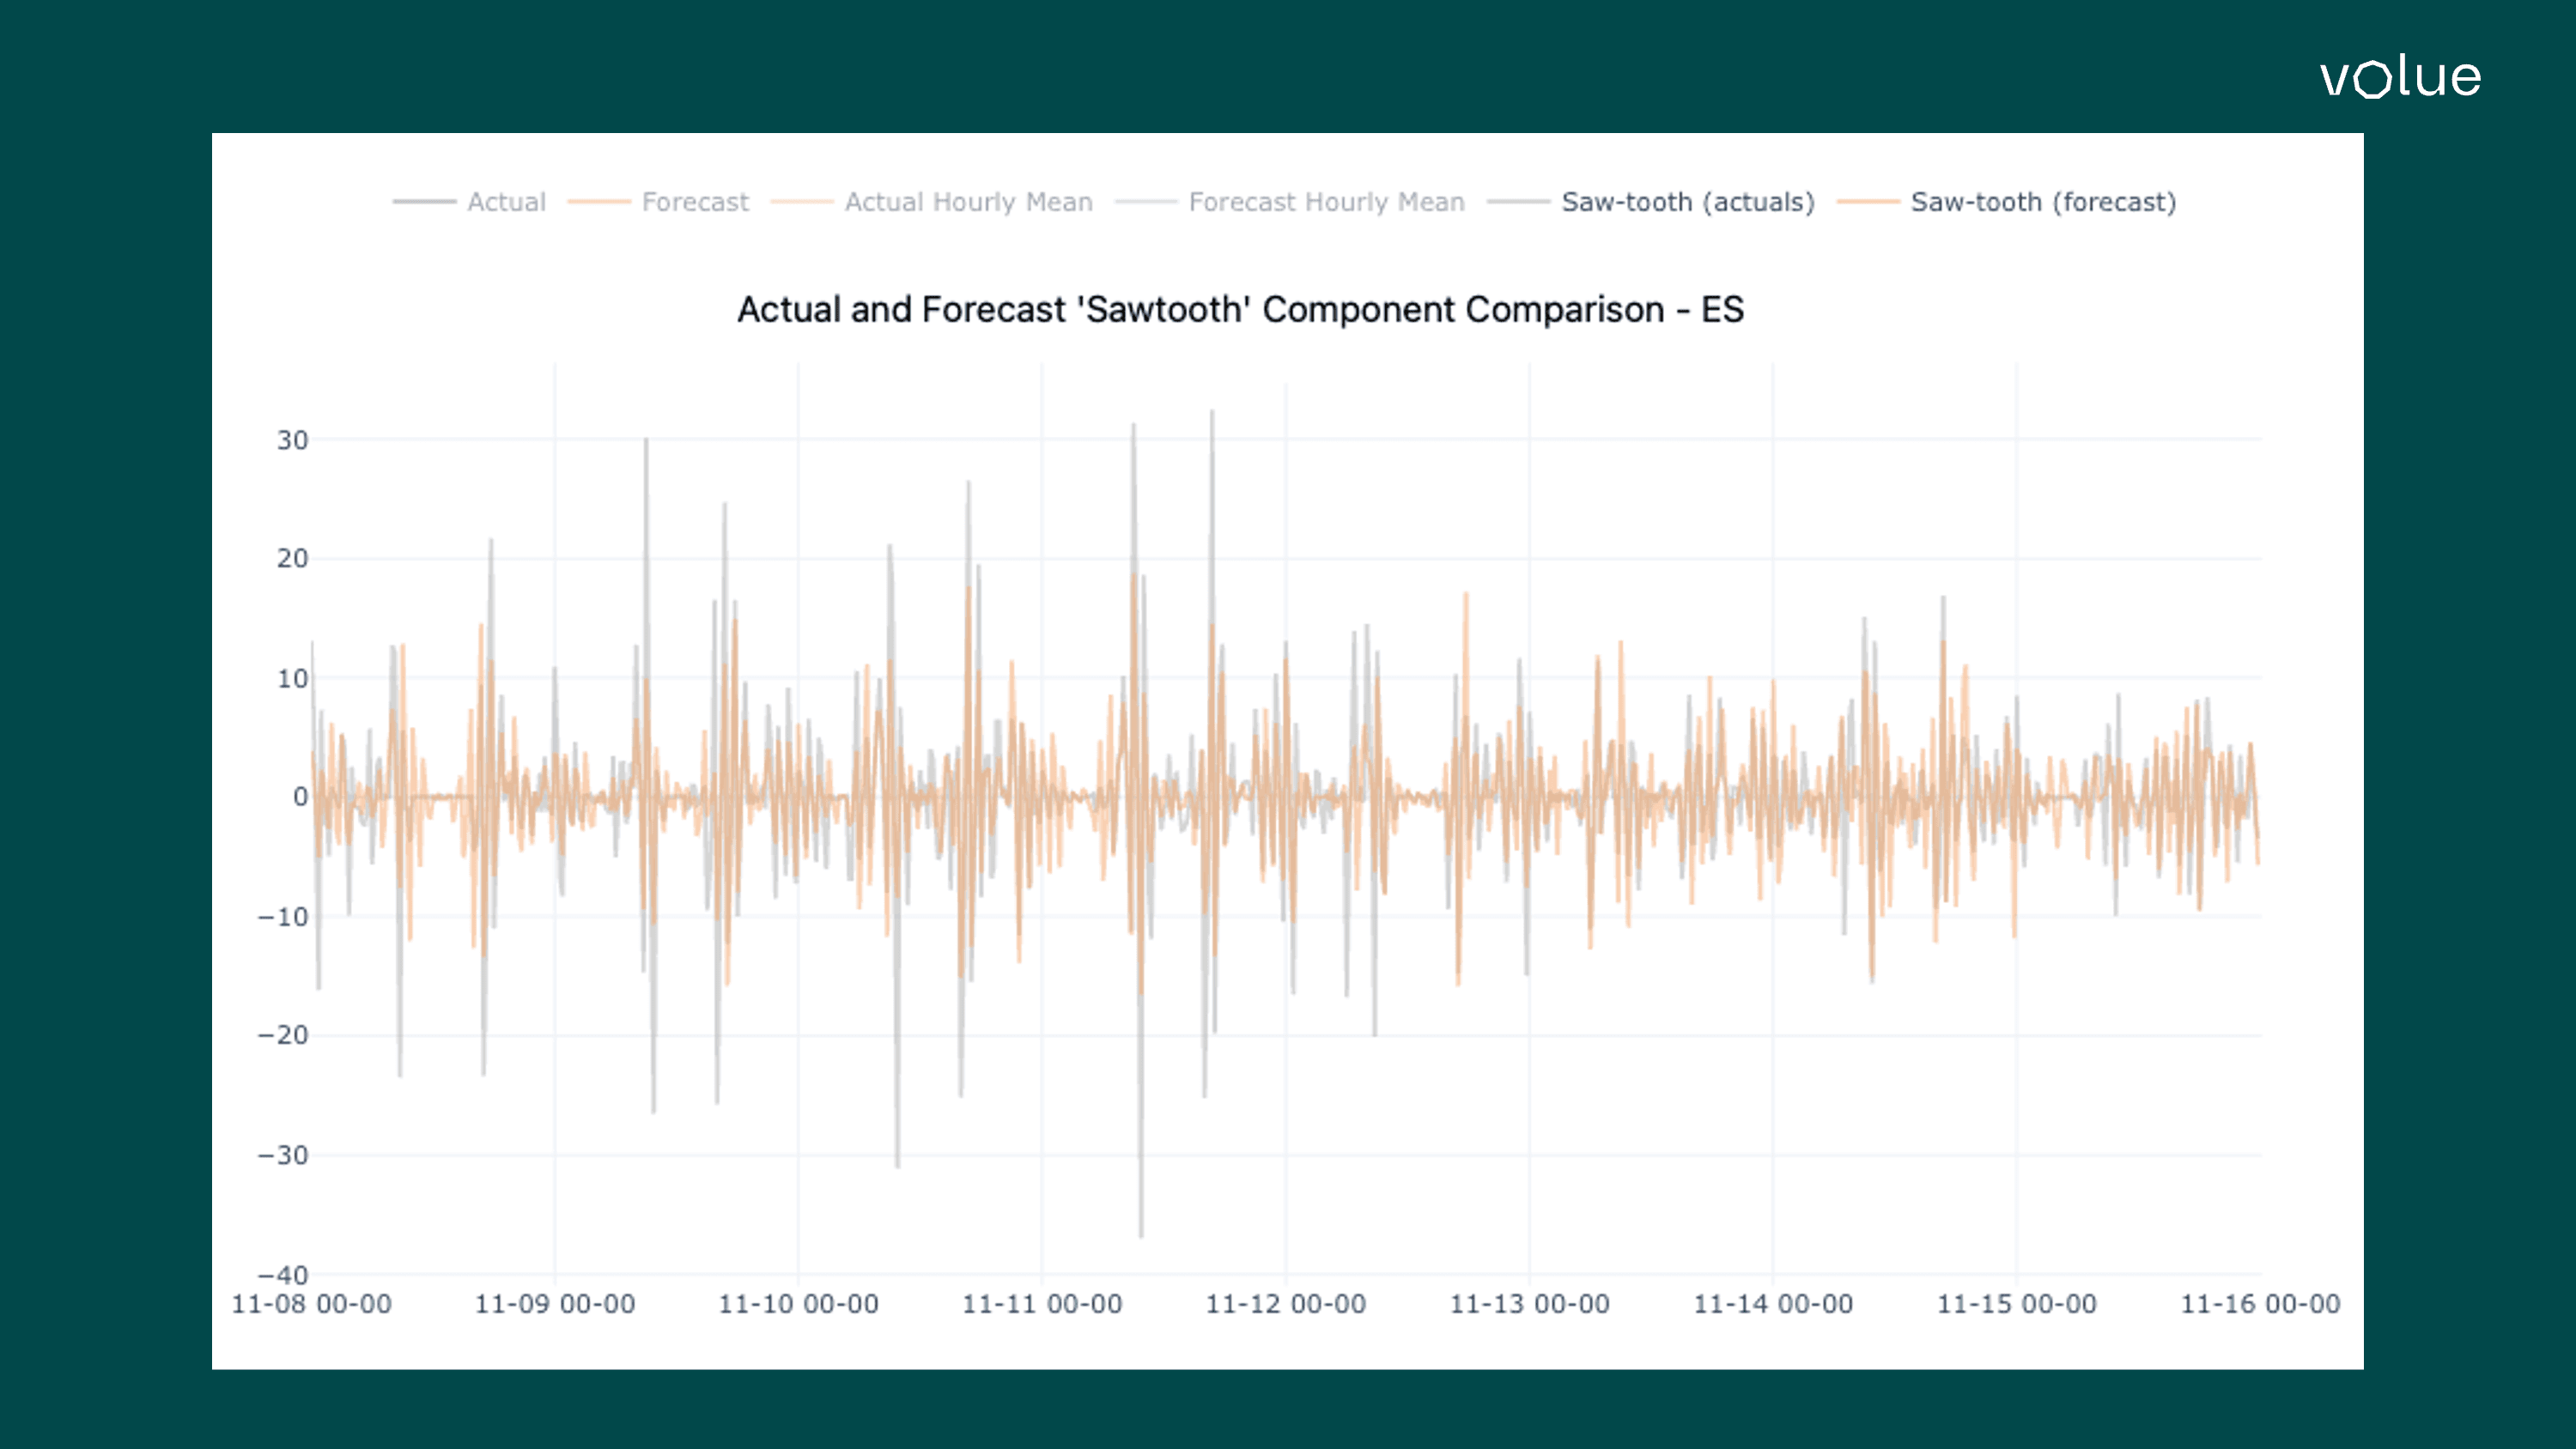
Another major change in the model release of 11 November was a package of new features aiming to better predict the saw-tooth 15-minute shape. Instead of using a single machine learning model to forecast all merit order curves, we now use groups of models to forecast the merit order curves for 15-minute MTUs. Our internal modelling approach now incorporates additional features, specifically engineered to capture the saw-tooth pattern. The model can learn the pattern from a combination of these features and from the patterns exhibited in the recent market data.
The charts below show the changes in the spreads between every 15-minute period and the average of the hour in both the delivered prices (grey) and our latest forecast before the closing of the spot (yellow). We can see from the analysis below, how after the 13 November, the forecast of 15-minute-hourly spread has improved.

Markedsdata og prognoser for energimarkedet