
Volue Benchmarking

Benchmark Your Forecasts and Trades Against Real Data From Your Peers

Volue Benchmarking ranks your day-ahead price forecasts and intraday trading results against anonymous peers in your price area. Every result comes from data that participants submit, so you see where you stand and where to improve.

Silhouettes of a team in front of orange price charts

Your own data can’t tell you whether a result is good

You track your forecast error and your intraday execution. You can’t see how they compare with the rest of your market.

Market conditions affect every participant. When volatility rises, forecast errors increase across the market. When liquidity is low, every desk pays more to execute. Without an external benchmark, you can’t separate your performance from the market’s.

A peer comparison shows where your forecasts and trading outperform or underperform your peers. You know where to improve and where to invest.

Why compare

Every result, measured against your market

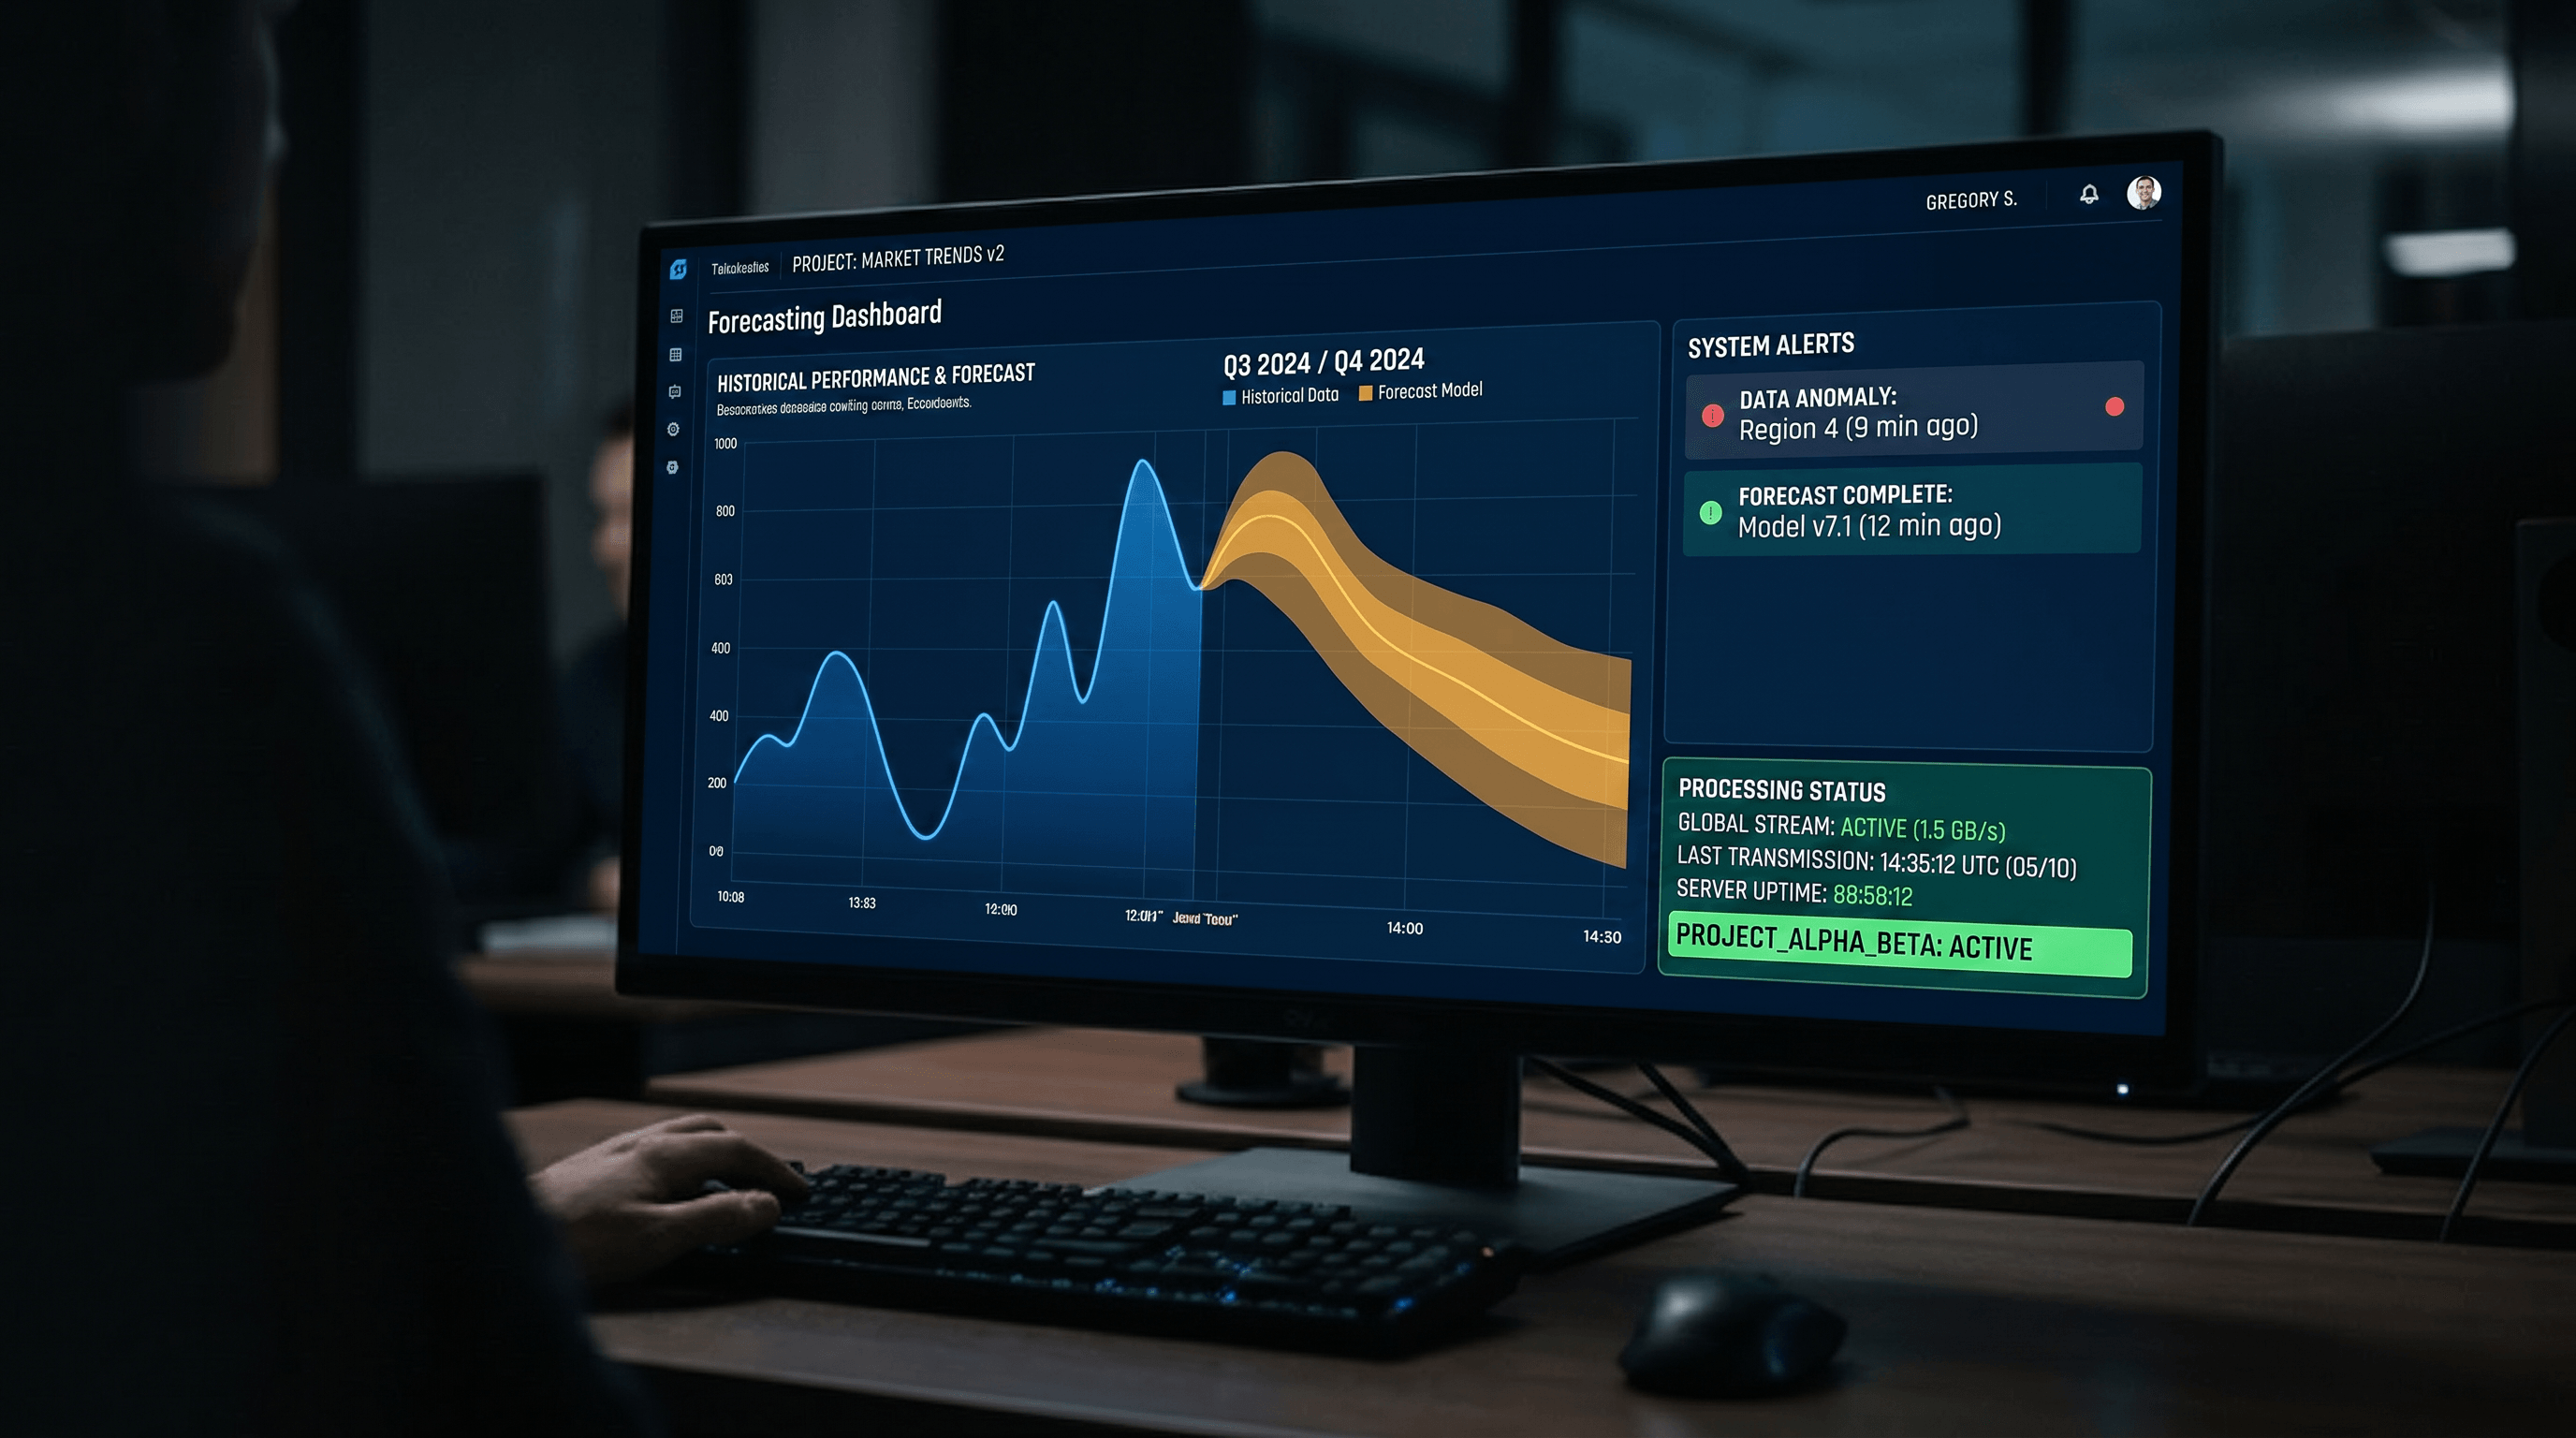
Forecasting dashboard with a day-ahead price curve and ensemble band

A market reference shows whether your model outperforms or underperforms peers in your price area, and in which conditions.

Compare your intraday results with peers trading the same market, and see where you capture more value and where they do.

Give the board, lenders, and regulators a peer comparison built on real data, and decide where to invest in models, data, and trading.

What you can benchmark

Benchmark your spot forecasts and your intraday results

Both modules score you against real data from anonymous peers.

Spot price forecast accuracy

Your day-ahead price forecasts are scored against the clearing price and ranked against peers in your price area. You see your quartile position and trend, with separate results for peak and negative-price periods.

  • Mean absolute error

  • Directional accuracy

  • Error in peak and negative-price periods
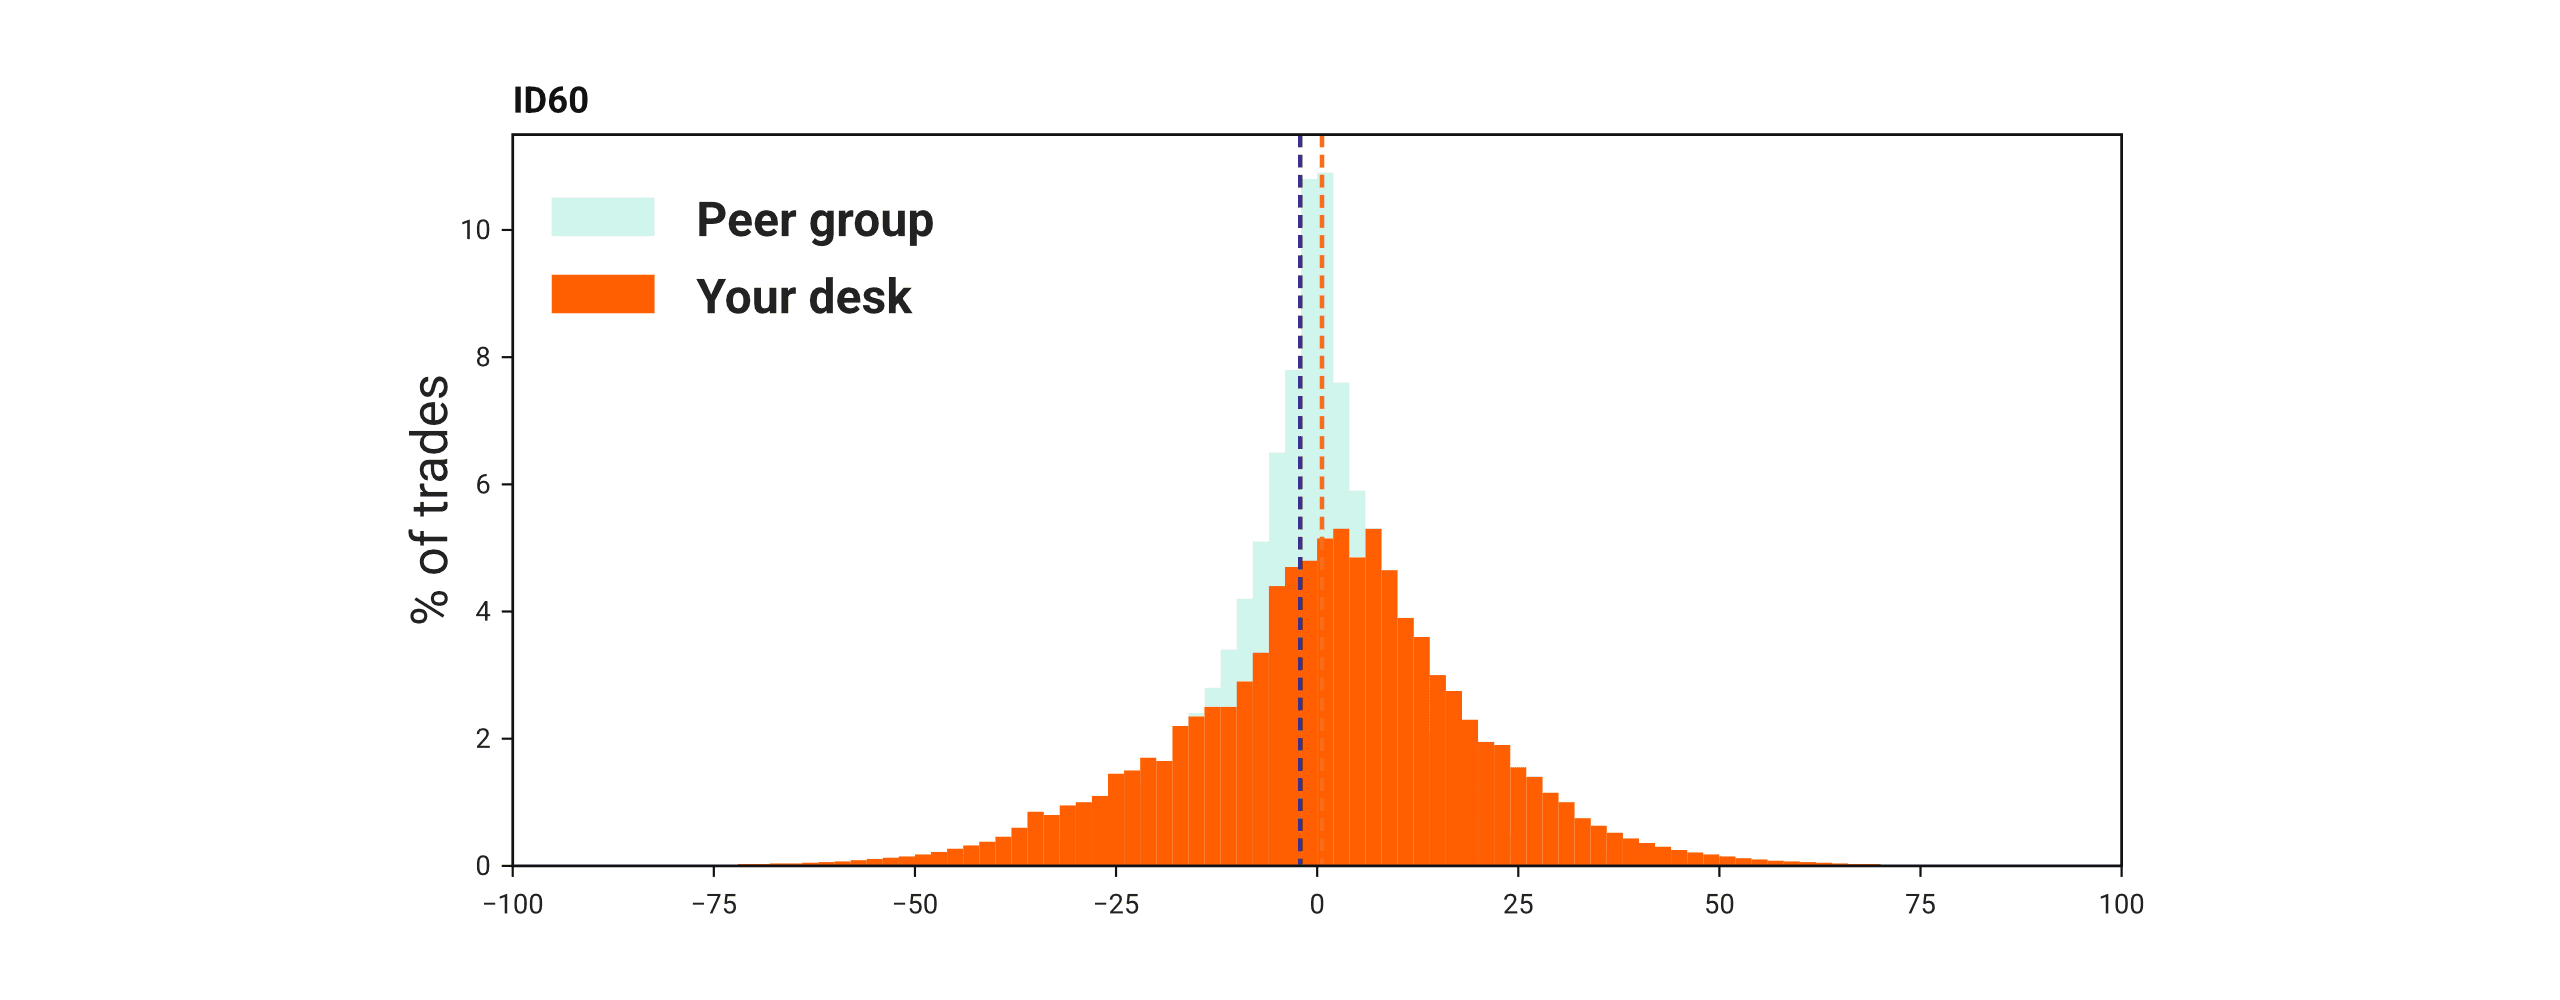
Intraday performance

Your execution prices in continuous intraday are compared with the volume-weighted ID1, ID3, and spot indices in EUR/MWh, and ranked by percentile against peers.

Execution quality, against the peer average and the top quartile:

  • Time to fill

  • Order management transactions per trade

  • Maker share of volume

  • Fill ratio

  • Time at the best bid or offer

  • Spread capture

Use cases

What a peer view of your price area shows you

Analyst working on a laptop with a forecast chart

Validate your forecasting model.

Heads of trading and quant analysts see how their own model ranks against peers in their price area, and decide whether to keep refining it or rebuild it.

Price chart over a map of power markets

Track your accuracy through market changes.

When market rules or conditions change, such as a new flow-based domain or a shift in the generation mix, day-ahead traders see whether their accuracy moved with their peers or on its own.

Three traders reviewing execution results on a screen

Find where your execution loses value.

Intraday traders compare their time to fill, fill ratio, maker share, and spread capture with the top quartile, and see which part of their execution to fix first.

Analyst monitoring model performance on a laptop

Test each change in live conditions.

Quant analysts backtest a new model, data source, or execution algorithm, then see how it performs against peers once it is live.

How it works

From upload to peer position

01

Upload your day-ahead forecasts. Intraday results from Volue trading customers are collected automatically.

02

Your data is anonymized as it arrives.

03

Volue compares it with real data from peers in your price area.

04

You see where you stand for every period in which you contribute data.

Your data stays yours

How your data is protected

  • Anonymized at the point of ingestion

  • Peers see only ratios and percentages, never prices, volumes, or counterparties

  • Your data is protected by contract

  • You see peer results only for the periods in which you contribute data

Why you can trust the results

  • Built on real data that participants submit

  • Scoring methodology governed by a third-party committee

  • Each result shows how many participants contributed

  • Equal scoring, whichever forecasting tools you use

Get started

See where your forecasts and trades stand

Book a demo to see how Volue Benchmarking scores your forecasts and trades against peers in your price area.

See where you rank against your peers

FAQ

Frequently asked questions

Volue Benchmarking joins your day-ahead price forecast to the settled EPEX SPOT or Nord Pool auction price and scores it with the same method used for every participant in your price area. You see your quartile position, your trend over time, and your error in peak and negative-price hours, next to anonymized peers.

You upload your day-ahead price forecasts every week, by file or API. For Intraday performance, results from Volue trading customers are collected automatically. You see a week’s results only if you contributed data for that week, which keeps the comparison fair for every participant.

No. Your data is anonymized at the point of ingestion, and peers see only ratios and percentages, never prices, volumes, or counterparties. Contracts prohibit Volue from using your data in its own models or commercial decisions.

No. Scoring runs on the forecasts you submit, so participants using in-house models or other vendors’ forecasts are scored on equal terms. Each result also shows how many participants contributed, so you can judge the size of the cohort behind it.