Fundamental Data and UMMs
The Short-Term Power Forecast and analysis gives you a complete market overview that helps you optimise your continuous trading operations in the balancing market, intraday and Spot market.

Weather Driven Fundamental Forecasts
The weather-driven fundamentals data product consists of models and actuals data for power consumption, and power production from wind and solar sources. In addition to this, residual load is calculated as power consumption - wind power production - solar power production.
Urgent Market Messages
UMMs (urgent market messages) contain information that may be of interest to market players, including details regarding outages (planned or unplanned) that reduce the generation or consumption capabilities of a plant, unit, or transmission line.
Climate Data
Weather information from the past, and can be used to look at potential power production/consumption in the future.
Updated Urgent Market Messages
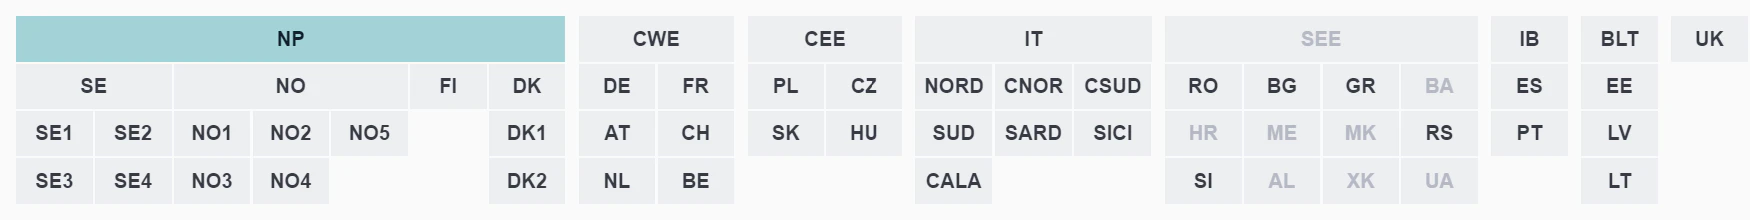
What price areas do we cover?
UMM product covers most of the European Area, with the exception of Ireland, Turkey and several countries in South East Europe. For full details of the regions covered, please see the diagram below:

What time frame is covered and with what granularity?
The time frame depends on the area/technology, usually ranging from a day-ahead up to 2-3 years ahead.
Presently, we provide outage information aggregated per technology, for each (price) area. All curves are available in 15-minute resolution.
How is the data structured?
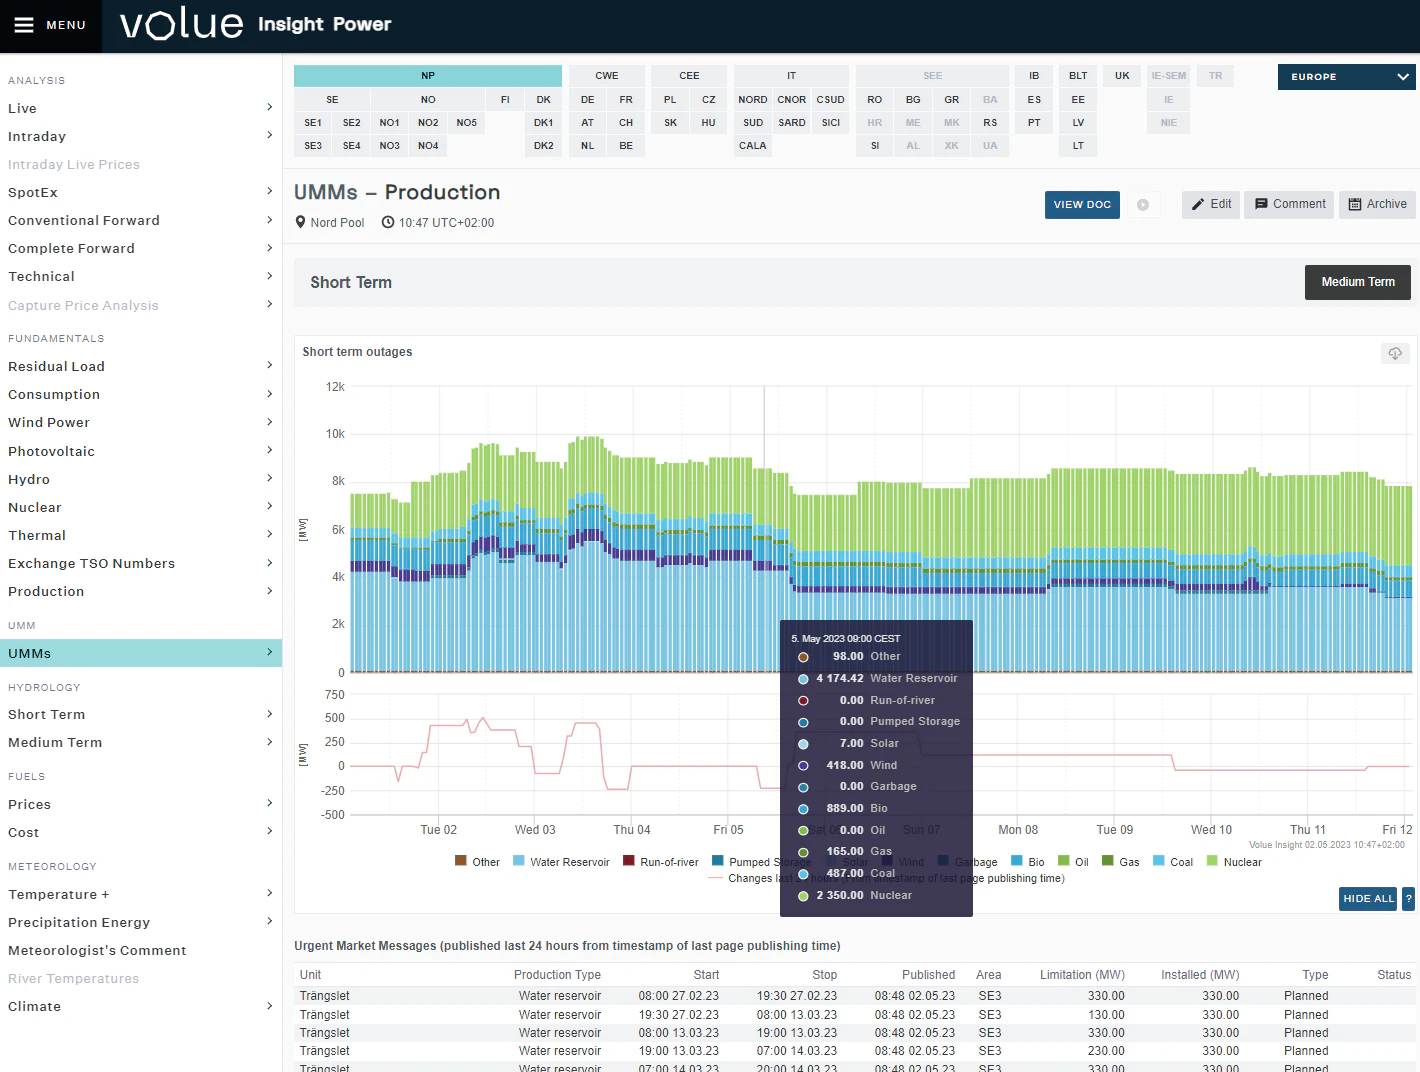
UMM information is published on the Insight App under ‘Fundamentals > UMMs’, and in the API. It is divided between the ‘Production’, ‘Consumption’ and ‘Transmission’ pages, and for each of these categories, we offer short- and medium-term forecasts and a historical overview.
Outage information
The outages are published in graphical form, aggregated by technology, and more details are provided on a per-unit level in the tables below.
The tables contain the following information:
- the name and type of the affected unit and its price area location,
- the capacity reduction as a result of the outage,
- the outage start and end and message publication times,
- whether the outage is planned or unplanned, and whether the message is active or has been canceled.

Insight by Volue has entered a partnership agreement with Reactive Technologies in April 2024 to deliver a series of product enhancements related to UMMs, offering ultra-fast, unique grid insights for short-term power traders. Read more about the partnership here.
Curves Types
Outages
In the API, you can find the outage curves by adding ‘outage’ as a category in your search.
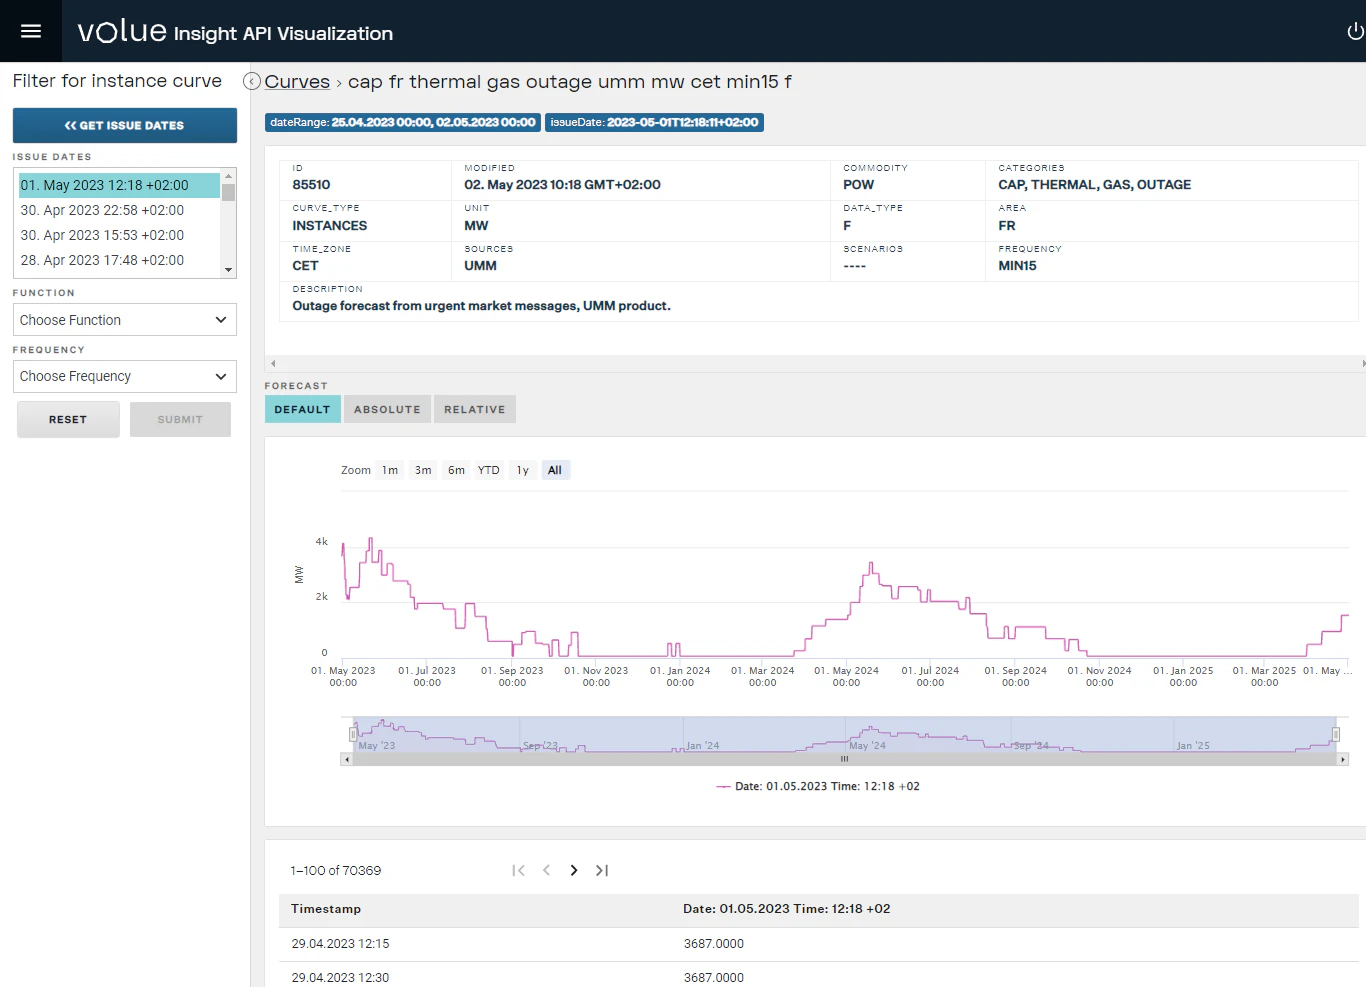
There are 3 main types of forecast instance (‘F’ curves) for outages, updated every time a new UMM is published at the source:
- Power production: cap {area} {asset type} outage umm mw cet min15 f
- Power transmission: exc {from_area}>{to_area} ntc outage umm mw cet min15 f
- Power consumption: con {area} outage umm mw cet min15 f
For the power production curves, we also provide actual forecast (‘AF’) curves, to make it easier to follow the actual historical development of the outages.
These curves have names of the form: cap {area} {asset type} outage umm mw cet min15 af

Available capacity
Available capacity forecast curves from the UMM product have the following name format:
cap {area} avail {asset type} umm mw cet min15 f
These curves are generated by subtracting the outages for a given area & technology from the aggregated installed capacity. The installed capacity used here is the sum of the installed capacity of all active assets (units) included in the UMM database for the given area & technology combination.
Note: The aggregated installed capacity for unit & technology combinations in the UMM database may differ from those published by external sources. This is due to differences in how sources calculate their aggregated figures, and which assets/units they include in the total.
For more information regarding the underlying assumptions in the different available capacity curves we provide in the API, check also the FAQ page.
How often is the data updated and published and which sources are used?
The curves in the API are updated with a 5 - 15 min delay after a new UMM is published at the source.
The sources are: NordPool, Entsoe Transparency, EEX Transparency, RTE, Elexon, and Gassco.
Get in touch

Carsten Fock-Wenzel, Solution Sales Specialist